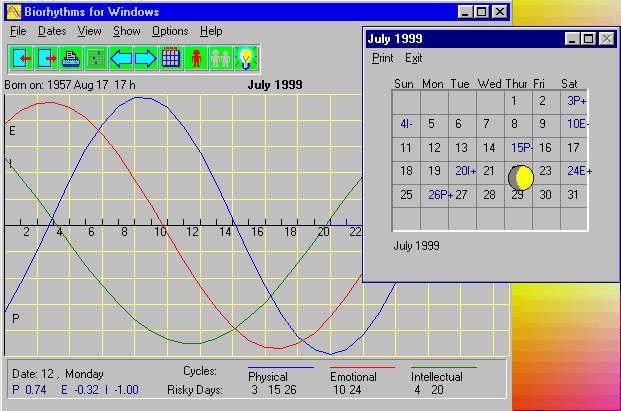
Enjoy the program and its user friendly interface. I hope this simple but powerful tool will be used not just for leisure, but also will help you to avoid dangers that might arise planning important business meetings or trips on a risky days. Printed Biorhythms Chart also could be a nice present to your friends.

Main features of the program are:
- Easy to use - all actions can be performed with the mouse, even not touching the keyboard;
- Resizable Chart;
- Possibility to export Biorhythms Chart to other Windows applications;
- Built-in Calendar that covers 29 centuries and shows risky days;
- Two different ways of printing of the Chart - WYSIWYG or high quality full page charts;
- Shows Biorhythms of two people simultaneously (compatibility of a couple);
- Hardware requirements are minimal - Windows 3.1 or higher, PC 386 SX or higher;
- Easy-to-read User's Guide, simple installation.
Enjoy!
If you already have file VBRUN300.DLL in your WINDOWS/SYSTEM directory, save time and Download the Program without this file![]() Secure Orders
Secure Orders

Reading a Biorhythms Study
Each picture on the screen shows three separate curves, marked P, for Physical rhythm, E for Emotional rhythm and I, for Intellectual rhythm. Depending upon the day of the month, the curves are either above or below the horizontal axis, which represents the mean level. The positive phase of each curve is above the axis and the recovery phase is below the axis. Biorhythms may therefore be used to forecast whether one will be in good or mediocre form, on a given date.
Consistency of Two Persons
By comparison of Biorhythms of two persons you can determine degree of their consistency. If all three curves are in the same phase, that is for both persons they are rising and falling more or less simultaneously, then there is a big chance that these people are compatible and can be a good partners. If phases of curves are almost opposite, then there is a big possibility that their relations could be in a disharmony.
For more thorough Interpretation...
Advocates of Biorhythm theory do not only establish calendars for the high and low periods of our vitality, they also claim to be able to forecast critical dates upon which the individual, in a state of least resistance, will be exposed to more risks than normally. These dates do not correspond to the lowest points on the curves, as would seem logical, but to the points at which the curves intersect the axis, i.e. the phase changes.
Obviously, when only one curve intersects the axis, which occurs regularly and frequently, then the risk on that day is not very great. However, if two curves change phase simultaneously, then particular care should be taken. This is, briefly, the theory of those who believe in Biorhythms, backed up by statistics.
Copyright © 1997 Halloran Software, Los Angeles, California
Author: Valentas Daniunas
Last modified on August 8, 2018.
http://www.halloran.com/biorythm.htm